Final Salary Pension Transfer Risks (FEB 2020)

Defined Benefit Transfer Risks
When clients’ benefits are within the Defined Benefit world, all the risk is managed by the Defined Benefit scheme itself and the sponsoring employer. When a transfer into a defined contribution (DC) pension is completed, the investment risks and their management become the direct responsibility of the adviser and the client.
Members in Final Salary Schemes (Defined Benefit Schemes) need to make sure that their understand what that means and what outcomes they could face. A good place to start is with the four concepts – longevity, sequence of returns, volatility and inflation.
Once members understand these concepts, then we can move on to an analysis of their personal circumstances and give appropriate advice on a Final Salary Pension Transfer. Here is a simple example to explain each concept.
A member who:
• has £100,000, as a Final Salary Transfer Value invested in a personal pension pension fund
• withdraws £5,000 annually in arrears
• achieves 4% per annum growth after all charges.
1. Longevity risk
Taking the example and plotting the outcome, over time, the £100,000 will be eroded by the withdrawals and the fund will run out shortly after the 40th anniversary

If the member lives until this point, they’ll face financial hardship because they can no longer rely on this fund. This is known as longevity risk.
2. Sequence of returns risk
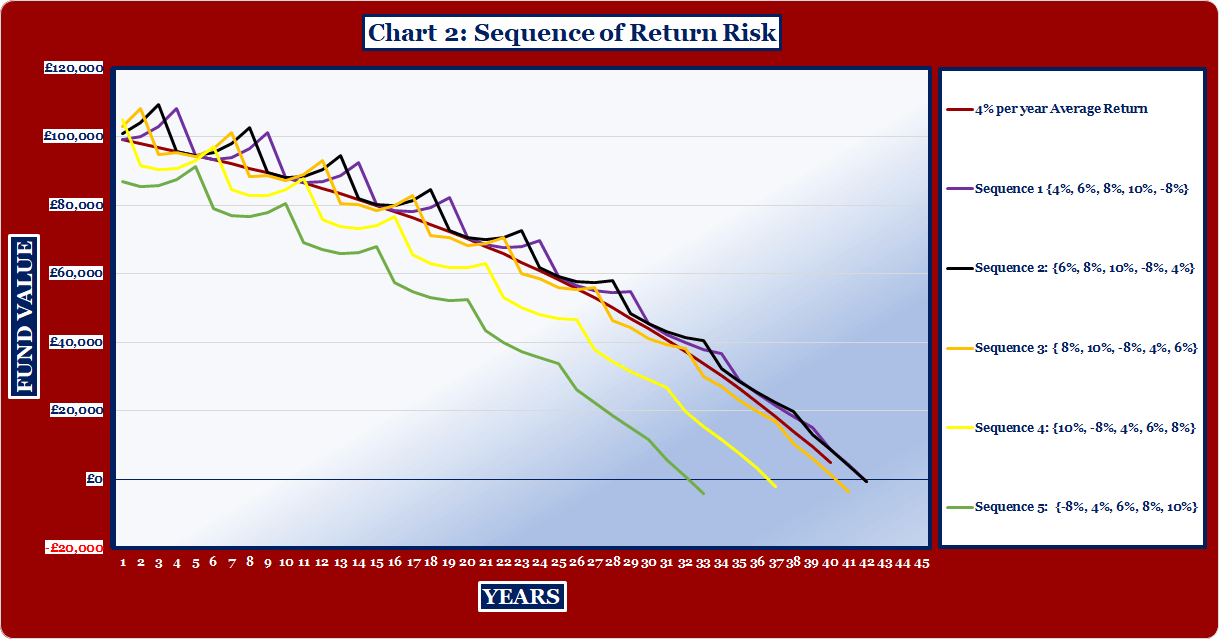
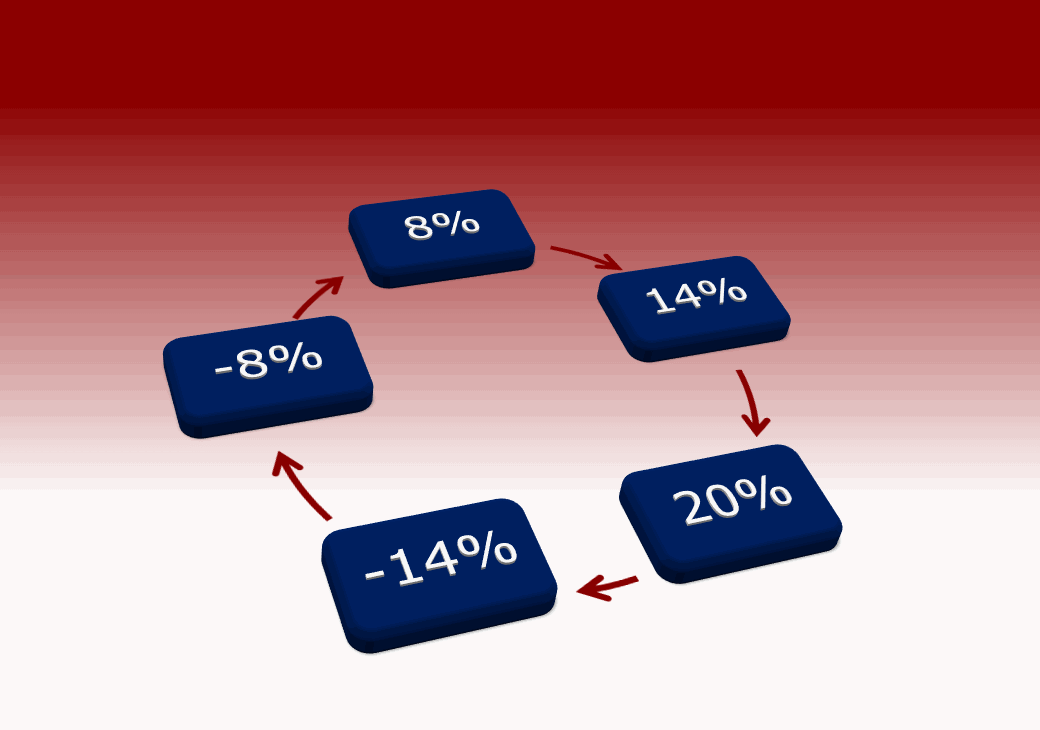
As we know, the investment markets don’t go up every year by a fixed amount – they fluctuate over time. To demonstrate how the investment markets work and the concept of ‘sequence of returns risk’, it’s helpful to use a simple sequence of returns over a five year period as shown below:

The average over this five year period is 4% per year. We can generate five sequences of return (1) 4%, 6%, 8%, 10%, -8% (2) 6%, 8%, 10%, -8%, 4% (3)…… and so on. Just choose a starting point for the sequence and then follow the numbers clockwise. To create a sequence that’s longer than 5 years, just keep going clockwise around the circle (repeating the five year cycle).
Then use these sequences within the example and plot the outcome.

This shows that the sequences have different outcomes. Two of the sequences result in more money remaining after 40 years than the average 4% pa return scenario used for longevity risk. Three sequences result in money running out sooner. The worst case scenario is the fund runs out after 33 years. This demonstrates the sequence of returns risk.
3. Volatility risk
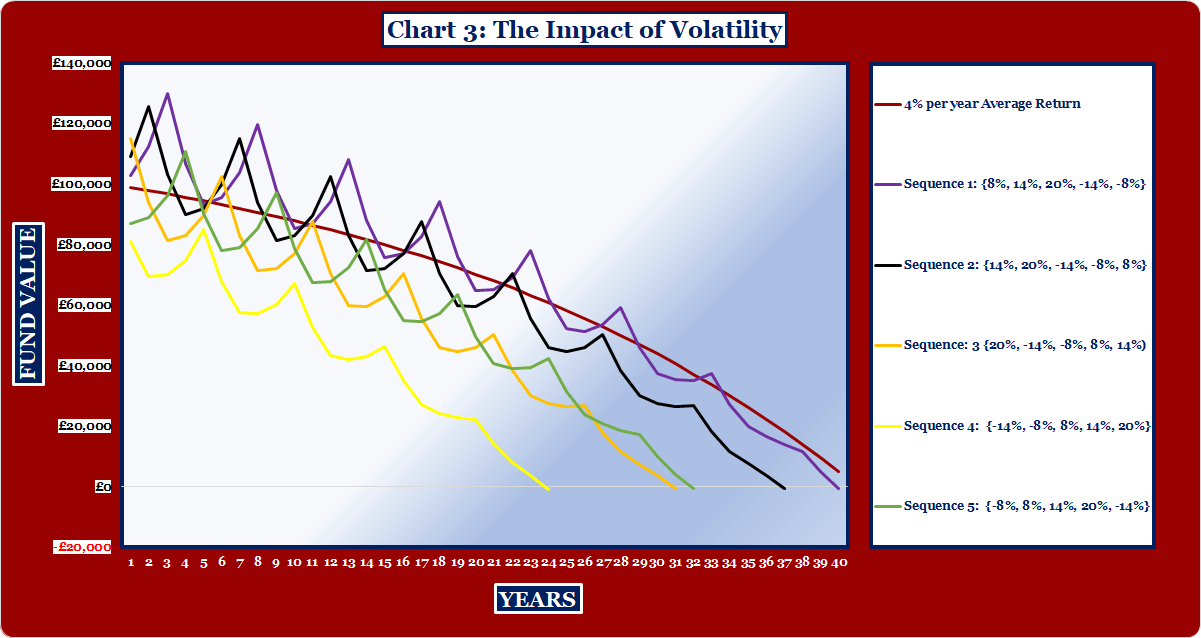
However, what happens if the investment returns go up and down by greater amounts? We can demonstrate the concept of volatility risk, simply by taking the simple sequence of returns and making them more volatile. The average over the 5 year period remains at 4% per year.

As before, you can use these sequences within the example and plot the outcome.

This shows that volatility has a detrimental effect. All the sequences result in money running out sooner than the 4% pa average return. The worst case scenario is the fund runs out after 23 years. This demonstrates volatility risk.
4. Inflation risk
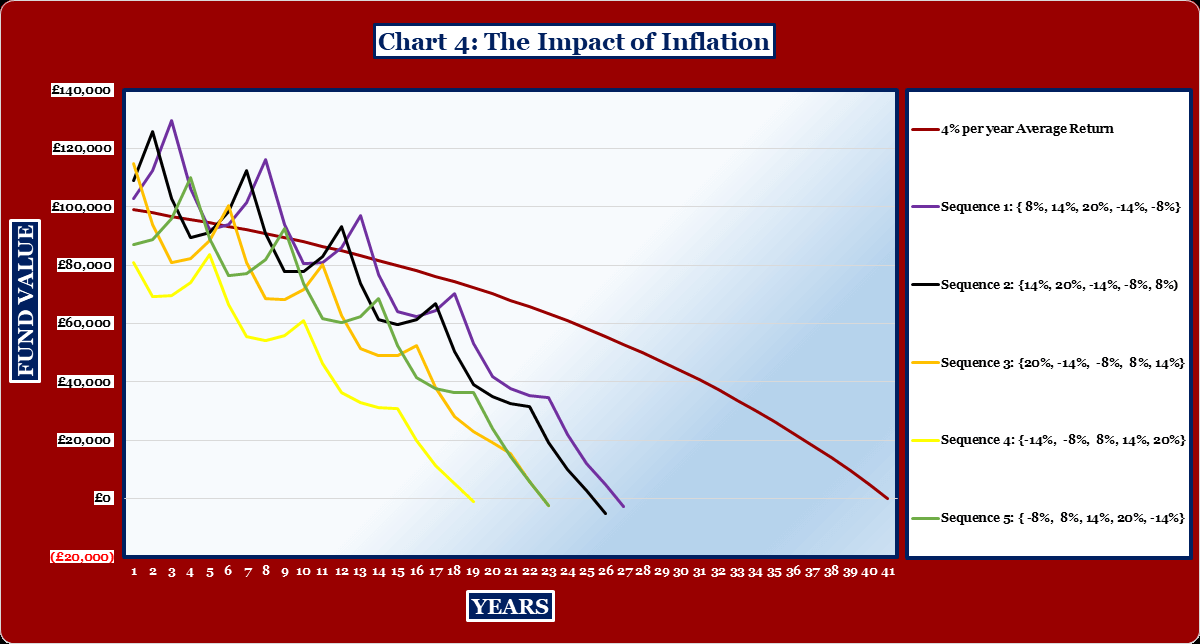
To demonstrate inflation risk we just need to take the example in 3 above and increase the rate of withdrawal by inflation. We do this to maintain the purchasing power of the withdrawals.
We use an inflation rate of 2% per year and plot the outcome.

This outcome shows all four risks and their combined effect is very different to where we started. All the sequences result in money running out much sooner than the 4% pa average return. The worst case scenario in this example is the fund running out after 19 years and the best case scenario is 27 years. Once members understand, they can make more informed decisions and have a greater understanding before committing to a transfer.